
[The GameDiscoverCo game discovery newsletter is written by ‘how people find your game’ expert and GameDiscoverCo founder Simon Carless, and is a regular look at how people discover and buy video games in the 2024s.]
Your game’s sales estimates: Two hot spreadsheets

One of the things we get asked about a lot at GameDiscoverCo is: what financial expectations should I have for my game, based on how it’s pacing pre-launch or at launch?
To which our answer is… every sale is like a blessed drop of water as you trudge through an endless desert, my child.
But more seriously, we can get very basic, ‘indicative’ ideas of how titles will do, pre-release or shortly post-release. How? We can combine pre-release info like Steam wishlists with post-release info like pricing, sales ratios, and ‘gross to net’ rates.
We’ve done a lot of research on these subjects over the past year or two – for example, here’s how you get from your Steam gross revenue to your Steam net revenue, here’s how Week 1 on Steam compares to Year 1, and a survey on how Steam wishlists might convert to sales after a week.
And while the following two spreadsheets will come with masses of disclaimers, they provide some important data to ballpark estimate possible returns on your game(s). A lot of the time, devs just have no idea what to expect. So here’s a starting point.
Method 1: GameDiscoverCo’s basic predictions
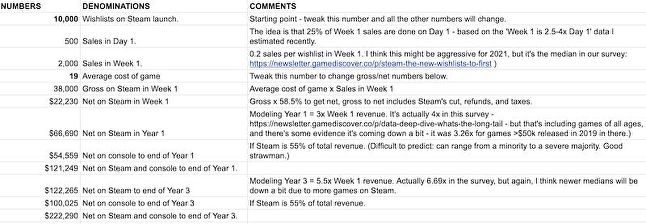
Firstly, GameDiscoverCo made a super simple Google spreadsheet for some of our regular clients, and is now sharing it with you all. Copy or save the spreadsheet to edit it. There are just two things you can change without editing formulas: the number of Steam wishlists at launch, and the average global price in USD of your game.
From there, the spreadsheet makes a bunch of extrapolations to work out: Week 1 Steam sales(as well as Day 1 Steam sales as a bonus); Week 1 Gross & Net Steam revenue (presuming you’re not in a country that has 30% tax withholding from the US!); Year 1 console net revenue, Year 1 total net revenue, and then 3-year Steam revenue, 3-year console revenue and 3-year total net revenue.
So the example here: a game with 10,000 Steam wishlists on launch that converted its first week at 0.2 sales per wishlist (so 2,000 sales in its first week) would end up making a net of $222,290 across PC and console over three years. (Presuming you discount it, and all that good stuff.)
The biggest gotcha here by far is ‘Week 1 sales compared to launch wishlists’, as we constantly mention – our data says it can be as low as 0.03 and as high as 1 sales per wishlist. So tweak the formula for a variety of scenarios.
Also: this particular spreadsheet is a bit more conservative on Week 1:Year 1 revenue ratio (which we put as 3x) than our actual surveys. And console revenue vs. PC is just a total handwave. But if you want a super easy look at possibilities – here it is!
Method 2: Fellow Traveller’s (sophisticated) predictions
What’s that, you say? You want the Rolls Royce of prediction models, and not the spluttering old jalopy that GameDiscoverCo just tried to sell you? Fine.
Well, good news – the wonderful folks at narrative game publisher Fellow Traveller are making freely available via the GameDiscoverCo newsletter its internal forecasting template (Google spreadsheet link, make a copy to edit) which it shares with all its developers.
The Australian-headquartered indie game publisher uses this model to “have some sort of month-by-month forecast both for our own budgeting and to give our developers an idea around monthly cashflow, when funding will be recouped, etc.”
Fellow Traveller has put out games like Paradise Killer, Genesis Noir and Neo Cab — narrative games of a specific type — and they suggest they “wouldn’t want to imply that these numbers are gospel or industry standard.”
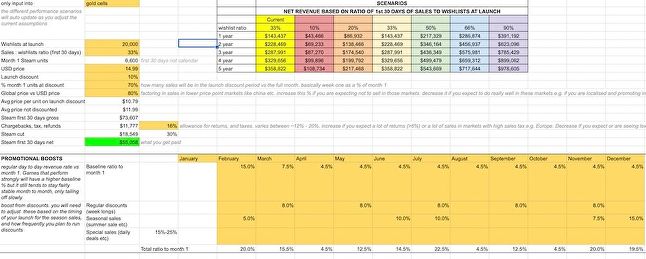
However, they have constructed a much more sophisticated version of the GameDiscoverCo spreadsheet. We’d particularly like to highlight the following:
● All of the Fellow Traveller calculations are based on Month 1: Launch Wishlist numbers (not Week 1: Launch Wishlist, as we generally tend towards!) So don’t get confused, as we initially did.
● The document specifically allows you to easily switch your game’s Month 1 Sales: Launch Wishlist ratio between multiple possibilities: everywhere from 10% (0.1) to 90% (0.9), and all of these options and many more are very possible! (Don’t count your chickens, etc.)
● There’s some really nice bells and whistles built in, like being able to enter the launch discount, tweaking the global average price vs. the USD price depending on your country mix, and so on.
● What’s even nicer is that there are some clever sales percentages built in to estimate the effect of being in a regular week-long Steam discount vs. a ‘big’ seasonal sale like the Summer Sale vs. a spotlight sale like Daily Deal/Midweek Madness. They’re all listed as a percentage of Month 1 Revenue, and broadly based on real-world Fellow Traveller data.
What this document doesn’t show is PC revenue outside of Steam (you’ll have to input those percentages yourself), or console revenue (again, you’ll need to enter those percentages by hand. There’s a very rough estimation that Switch sales boost percentages at lower discount rates.)
Why? It’s just that Fellow Traveller (and GameDiscoverCo) didn’t feel comfortable putting ‘typical’ console market share percentages there, because it can vary so radically. We’ve covered this a couple of times in the newsletter. Here’s an example from late in 2024, if you want to peep some numbers.
Chris Wright at Fellow Traveller also wanted to add: “The model is most useful once you have real data from your launch, and then update [the spreadsheet] over time… Once you can see things like where your baseline is, what boosts you’re getting from promotions and you start to schedule in your sales, it allows you to more accurately predict the tail.”
Anyhow, thanks again to Fellow Traveller for putting this out there. We do feel like this level of communication for publishers to pass on to devs really helps everyone understand what might happen revenue-wise, before and after recoup. (And individual devs can use something like this for revenue estimation, too.) Transparency is king!
Concluding: we don’t have a crystal ball. But having solid numbers to plan your game’s release and cashflow on are important, and we think these publicly available spreadsheets are a good step in the right direction.
[GameDiscoverCo is a new agency based around one simple issue: how do players find, buy and enjoy your premium PC or console game? You can subscribe to GameDiscoverCo Plus to get access to exclusive newsletters, interactive daily rankings of every unreleased Steam game, and lots more besides.]
GamesIndustry.biz
Source link
Related Post:
- The Great Ace Attorney Chronicles Review – You Know These Methods, And They Still Work
- Fortnite trial judge decides Apple cannot stop developers linking to other payment methods • Eurogamer.net
- Valve Announces New Portable Console, Steam Deck; Will Play Your Steam Library
- UK charts: June 2024 console sales – PlayStation 5 No.1, Xbox Series X|S No.2, Nintendo Switch No.3
- PS4 Console Sales Limp to Just Over 116 Million
- July 2024 NPD: Switch was the best-selling console for unit sales
- Biomutant's 1m sales and Gearbox, Easybrain acquisitions drive Embracer sales to $389m
- Microsoft leaks Two Point Campus from developers of Two Point Hospital
- Take-Two sales dip in first quarter
- NPD June 2024: Xbox Series best-selling hardware platform in dollar sales, Nintendo Switch led in unit sales, Ratchet & Clank No.1